Report of Sixth IDEA meeting with information about the resource persons
Analysis of the data received from the Registration Form:

The pie chart shows that the majority of participants registered from Maulana Azad National Urdu University. This suggests that the meeting was well-received by participants from this institution. The other institutions also had a significant number of registered participants, which suggests that the meeting was well-received by participants from across India.

The image shows a pie chart with the following categories:
- Working in ODL mode: This category measures how many participants are working in ODL mode.
- Not working in ODL mode: This category measures how many participants are not working in ODL mode.
The graph shows that the majority of participants are working in ODL mode (71.1%). This suggests that the meeting was well-received by participants who are working in ODL mode. The other participants who are not working in ODL mode may have been interested in the meeting because they are considering working in ODL mode in the future.

The image shows a pie chart with the following categories:Full-time: This category measures how many participants are working full-time in ODL.
- Part-time: This category measures how many participants are working part-time in ODL.
- Contractual: This category measures how many participants are working contractually in ODL.
- No: This category measures how many participants are not working in ODL.

The image shows a pie chart with the following categories:
- Yes: This category measures how many registered participants are members of IDEA.
- No: This category measures how many registered participants are not members of IDEA.

The image shows a pie chart with the following categories:
- Less than 5 years: This category measures how many registered participants have been exposed to ODL for less than 5 years.
- 5 to 10 years: This category measures how many registered participants have been exposed to ODL for 5 to 10 years.
- 10 to 15 years: This category measures how many registered participants have been exposed to ODL for 10 to 15 years.
- 15 years or more: This category measures how many registered participants have been exposed to ODL for 15 years or more.

The image shows a bar graph with the following categories:
- Social media: This category measures how many registered participants heard about the meeting through social media, including WhatsApp.
- Email: This category measures how many registered participants heard about the meeting through email.
- Word of mouth: This category measures how many registered participants heard about the meeting through word of mouth.
- Other: This category measures how many registered participants heard about the meeting through other means.


The image shows a pie chart with the following categories:
- Morning Session: This category measures how many participants would prefer the meeting to be in the morning Session ie before lunchtime.
- Afternoon Session: This category measures how many participants would prefer the meeting to be in the afternoon Session ie after lunchtime.
- After Office Hours: This category measures how many participants would prefer the meeting to be in the evening Session ie after officer hours or in the evening.
The graph shows that the most convenient time for the meeting is the morning session (43.8%). This suggests that participants are more likely to be available in the Morning Session. The other times of the day also had a significant number of votes, which suggests that participants are also available in the morning and evening.
Themes suggested for future webinars:
Online Learning and Distance Education:


Overall, the pie chart shows that the IDEA online meeting was well-attended by participants from a variety of job titles. However, there were a few job titles with a significantly higher number of participants than others. This suggests that some job titles may be more interested in the IDEA online meeting than others.

Overall, the bar graph shows that the majority of respondents are still in service. This suggests that most of the respondents are currently employed and are able to provide feedback on the meeting. The number of respondents who have retired is lower, which suggests that fewer respondents are currently employed and are able to provide feedback.

Overall, the bar graph shows that the 6th Online Virtual Meeting of IDEA was generally well-received by participants. However, there are some areas where the meeting could be improved.

The bar graph shows the feedback from participants of the 6th Online Virtual Meeting of IDEA, based on how informative and valuable they found the meeting. The graph shows that the majority of participants (74.29%) found the meeting to be informative and valuable, followed by 24.29% who found it to be somewhat informative and valuable. 1.43% of participants found the meeting to be neutral, and 0% found it to be somewhat uninformative and valuable.
The following are some observations from the bar graph:Overall, the bar graph shows that the 6th Online Virtual Meeting of IDEA was generally well-received by participants. The meeting was found to be informative and valuable by the majority of participants.

The bar graph shows the feedback from participants of the 6th Online Virtual Meeting of IDEA, based on how easy they found the meeting to understand. The graph shows that the majority of participants (65.71%) found the meeting to be easy to understand, followed by 31.43% who found it to be somewhat easy to understand. Only 2.86% of participants found the meeting to be difficult to understand.
The following are some observations from the bar graph:
Overall, the graph shows that the 6th Online Virtual Meeting of IDEA was generally well-received by participants. However, there are some areas where the meeting could be improved.

The graph shows the feedback from participants of the 6th Online Virtual Meeting of IDEA, based on how they rated the personal approach and attitude of the expert/resource person in explaining and answering questions. The graph shows that the majority of participants (71.43%) strongly agreed that the resource person had a good personal approach and attitude, followed by 25.71% who agreed. Only 2.86% of participants somewhat agreed or strongly disagreed.
The following are some observations from the graph:

The graph shows the feedback from participants of the 6th Online Virtual Meeting of IDEA, based on how likely they are to recommend the meeting to their friends and colleagues. The graph shows that the majority of participants (68.57%) are very likely to recommend the meeting, followed by 22.86% who are somewhat likely. Only 8.57% of participants are not very likely or not likely to recommend the meeting.
The following are some observations from the graph:Overall, the graph shows that the 6th Online Virtual Meeting of IDEA was generally well-received by participants. The meeting was found to be valuable and informative by the majority of participants, and they are likely to recommend it to others.

The graph shows the feedback from participants of the 6th Online Virtual Meeting of IDEA, based on how they rated the overall quality of the meeting. The graph shows that the majority of participants (71.43%) rated the meeting as good or very good, followed by 25.71% who rated it as fair. Only 2.86% of participants rated the meeting as poor or very poor.
The following are some observations from the graph:Overall, the graph shows that the 6th Online Virtual Meeting of IDEA was generally well-received by participants. The meeting was found to be of good quality by the majority of participants.

The graph shows that the majority of participants were satisfied with the meeting overall (80%). The meeting agenda was also well-received (74%). However, the speakers and the question and answer session were less well-received, with only 65% and 62% satisfaction, respectively.
Overall, the image suggests that the meeting was well-received by the participants.
Findings of the Analyses
Here are the findings of the study from all the above analyses:


- Development of online courses and Open Schooling
- Integration of AI and microlearning in education
- Study material and contact hours for online education
- Exploring the implications of Generative AI in Open Online and Distance Education
- Bridging the gap in higher education through international collaboration
- Implementing the National Education Policy (NEP) 2020 in ODL and developing MOOCs
- Exploring new learning strategies and trends in ODL
- Enhancing the role and effectiveness of ODL through digitalization and blended learning
- Improving examination systems and teaching strategies in ODL
- Exploring the role of AI in flipped classroom learning
- Utilizing educational ICT tools and digital libraries for research and education
- Keeping up with the latest technologies and their application in ODL
- Workshops on evaluation tools and digitalization in ODL
- Addressing topics related to special education and inclusive pedagogy
- Providing support services for students in ODL
- Identifying research trends and multidisciplinary research in ODL
- Linking SDGs with ODL for skill development
- Promoting collaboration and international partnerships in ODL
- Exploring strategies to reach and facilitate Nomads in India through ODL
- Enhancing coordination between student Learner Support Centers (LSCs) and universities
- Making improvements in the examination system of ODL mode
Speakers whom they want to listen:
Confirmed Speakers:
- Prof. Asha Kanwar
- Prof. Mushtaq Ahmed I. Patel
- Chandra Bhushan Sharma (Director of IGNOU)
- Dr Santosh Panda (IGNOU)
- Prof. V. S. Prasad
- Prof. Fazal ur Rehman
- Dr Shajid Jamal
- Prof. D. Harinarayana: Contact number provided: 9491126969.
- Prof. Jeelani (Director, University of Hyderabad)
- Dr Sanjaya Mishra
My Welcome Speech during the programme
Ladies and gentlemen Good Morning, and welcome to the IDEA (Indian Distance Education Association) Monthly Virtual Online meeting, where we bring together esteemed individuals from the world of Open and Distance Learning (ODL) to engage in a dynamic exchange of ideas and knowledge. Our objectives are clear: To remain engaged with the current/latest developments in the field of ODL and its development, ensuring we stay at the forefront of innovation. To appraise the policy makers and stakeholders about the immense potential of ODL in reaching the unreached and increasing the Gross Enrollment Ratio (GER) in education. To benefit from expert lectures delivered by seasoned practitioners in the field of ODL, learning from their wealth of experience. To gain a comprehensive understanding of ODL perspectives from different angles, fostering a holistic approach to education. Let me give an overview of the monthly virtual meetings conducted till now, In January 2023, we delved into the thought-provoking theme of "National Education Policy - 2020 with special reference to ODL and Digitisation of Education." The keynote speaker for this conference was none other than Prof. CRK Murthy from IGNOU, New Delhi, who shared his invaluable insights on this crucial topic. In February 2023, we explored the theme "Education at Crossroads with special reference to ODL," where Prof. M. Aslam, the former Vice-Chancellor of IGNOU, New Delhi, enlightened us with his vast knowledge and expertise. March brought us the theme "Bridging the 'Gap' in Higher Education: Case of International Collaboration," with Prof. K. Seetharama Rao, the Vice Chancellor of BRAOU, Hyderabad, taking the stage to discuss this significant aspect of education. April was marked by the theme "Transformational Innovations in Distance Education," and we had the privilege of hearing from Prof. Mohan B. Menon, the former Deputy Vice-Chancellor of Wawasan Open University, Malaysia. His insights on innovative approaches left a lasting impression. Finally, in May, we explored the intriguing theme of "Generative AI and Implications for Open Online and Distance Education," with Dr. Ramesh Sharma, the Director of HRDC at Dr. Ambedkar University, Delhi, providing us with valuable perspectives on the intersection of AI and education. Each conference brought together esteemed experts in the field, and their diverse perspectives and knowledge enriched our understanding of key issues in distance education. We eagerly anticipate the upcoming conference and the invaluable insights it will bring.
Ladies and gentlemen, allow me to introduce you to Prof. Dr S.S. Chaugule, a distinguished academician with a wealth of experience in the field of Distance Education. With a remarkable career spanning over 42 years, Prof. Chaugule's expertise encompasses various domains, making him a true multitasker in the realm of education.
Prof. Chaugule's academic qualifications are impressive, holding multiple degrees including an M.B.A. in Human Resources, M.A. in English and Sociology, M.Ed., M.Phil. in Education, LL.B. in Specialization, and a Ph.D. in Education. As the former Director of the School of Education at YCM Open University in Nashik, he has demonstrated his leadership and expertise in guiding educational institutions.
What sets Prof. Chaugule apart is his extensive experience of 22 years in Distance Education. He has served as a Counselor, Coordinator, Evaluator, Book Writer, and Developer of self-instructional materials and Counselors' Handbooks. His contributions extend beyond teaching, as he has written 17 books, including four prescribed as textbooks at the university level and ten as Counselors' Training Guides. Additionally, he has published more than 25 papers in various national and international conferences, showcasing his commitment to scholarly research.
Prof. Chaugule's reputation as an international speaker is noteworthy, having been the Main Speaker at an International Conference in Thailand. He has also chaired numerous sessions in national and international conferences, where he has shared his insights and knowledge with fellow academicians. His international exposure includes visits to the U.S.A., Thailand, Bhutan, Nepal, and Kenya, where he presented his research papers at prestigious conferences.
As an academic leader, Prof. Chaugule has held significant positions, including Chairperson of the School Council and Member of the Academic Council at YCMOU, Nashik. He has also served as the Vice President of the Indian Distance Education Association (IDEA) and Executive Member of the Global Educational Research Association (GERA), reflecting his commitment to advancing the field of Distance Education on a global scale.
Prof. Chaugule's expertise extends to research methodology, management, assessment and evaluation, distance and open education, conducting training programs, counseling, and the development of self-instructional materials. His extensive experience as a guide and examiner for M.Ed., M.Phil., and Ph.D. programs at YCM Open University, along with his contributions as an external referee for Ph.D. theses, highlights his dedication to nurturing research scholars.
I request Prof. Chaugule to Chair today’s sixth IDEA Monthly Online Virtual Meeting.
With the permission of the chair, let me take pleasure in introducing today’s speaker,
Professor Vunnam Venkaiah is an esteemed scholar and academician who has made significant contributions to the fields of Open and Distance Learning (ODL) and Management Education.

With a career spanning over four and a half decades, he has held numerous academic and administrative positions, demonstrating his expertise and leadership in various educational institutions.
Teaching and Research Excellence:
Prof. Venkaiah's academic journey began as a Faculty Member in the Institute of Public Enterprise, Hyderabad, Andhra Pradesh. Throughout his 45 years of experience, he has taught both in conventional and Distance Education Universities, specializing in Management. He has also conducted extensive research and consultancy studies, guiding numerous research scholars to obtain M.Phil. and Ph.D. degrees. Under his guidance, 16 PhD and 4 M.Phil. degrees were awarded. His notable contributions in the field of Management encompass Marketing Management and Human Resource Management. In recognition of his outstanding work in research, teaching, and consultancy, the Government of Andhra Pradesh bestowed upon him the prestigious "Best Teacher Award" in 1995. Prof. Venkaiah has authored 16 books and published 43 research papers in the areas of management, Open Distance Learning, and Higher Education.
Pioneering Open and Distance Education:
Prof. Venkaiah's expertise in Distance Education is noteworthy, as he played a crucial role in the establishment and development of the first Open University in India, Dr B.R. Ambedkar Open University, Hyderabad. He held various positions in the university, including the Rector (Pro-Vice Chancellor). His profound knowledge in this field led him to publish numerous books and research papers on various aspects of Distance Education. His services have been utilized by renowned organizations such as the Commonwealth of Learning, Commonwealth Educational Media and Communication in Asia (CEMCA), and UNESCO, where he served as a trainer, researcher, and consultant in Open Distance Education, Application of Technologies, Quality Assurance, and Open Education Resources.
Administrative Leadership:
Prof. Venkaiah's administrative acumen is evident through his leadership roles in several esteemed institutions. He served as the Vice-Chancellor of Krishna University, Machilipatnam, Andhra Pradesh from 2012 to 2015. Furthermore, he held the position of Director at the Centre for Education Technology and Learning Sciences (CETLS) in Rajiv Gandhi University of Knowledge Technologies (RGUKT) from 2016 to 2019. His contributions were also notable during his tenure at Dr B.R. Ambedkar Open University, where he served as the Director of Academic, Director of Student Services, and Executive Director of GRADE (Prof. G. Ram Reddy Research Academy of Distance Education).
Commitment to Quality Assurance:
Prof. Venkaiah's expertise extends to the domain of Quality Assurance in Higher Education. He served as Chairman and Member Coordinator for the National Board of Accreditation (NBA) and the National Assessment and Accreditation Council (NAAC), India's premier Quality Assurance Agencies. He has assessed over 200 institutions, including 25 universities, and his valuable insights have been utilized by Distance Education Council, U.G.C., Indira Gandhi National Open University, and other central and state universities for policy formulation, quality assurance system design, ICT utilization, and human resource development. He has authored books, quality assurance manuals, and research papers in the field of Distance Education.
Global Engagements and Recognitions:
Prof. Venkaiah's contributions have been recognized on an international scale. He has travelled extensively, visiting numerous universities and countries, including the USA, Brazil, Italy, New Zealand, UK, Germany, Hong Kong, Singapore, and Sri Lanka. He received esteemed fellowships and awards, such as the Global Universities in Distance Education (GUIDE) visit fellowship in Italy, the Ford Foundation Visit Fellowship in Brazil, and the Fellowship of the Asian Association of Open Universities (AAOU) in Hong Kong. In 1999, he was honoured with the Best Teacher Award by the Government of Andhra Pradesh.
Thank you Venkaiah Sir for accepting our invitation and joining us physically at MANUU for the presentation, we welcome you once again.

Ladies and gentlemen, it is an honour to introduce Dr Ali Asgar, an Assistant Professor at STRIDE, IGNOU, and a true champion of multilingual distance education. With his vast experience and expertise, he has actively contributed to various training activities and has been a strong supporter of IDEA. Today, we are privileged to have him join us as a Discussant in our meeting, where his insights and perspectives will undoubtedly enrich our discussions.
After this introductory session, Prof. K. Murali Manohar, the President of IDEA, will deliver preliminary remarks and invite the President to proceed with the meeting. Following that, Prof. S. S. Chaugule will be invited to chair the meeting. Prof. Chaugule will then extend an invitation to Prof. Venkaiah, today's keynote speaker. Afterwards, the Chairperson will invite Dr Ali Asgar to serve as the Discussant of the Programme. The Chairperson will then open the session for Question and Answer. Participants are kindly requested to keep their questions concise and focused. Questions can also be posted in the Google Meet chat box during the presentation. Our technical team will assist in asking the questions if requested by the Chairperson. The meeting will conclude with a vote of thanks delivered by Dr Dorothy.
Finally Ladies and gentlemen,
We are delighted to have with us today Prof. Murali Manohar, President, of IDEA (Indian Distance Education Association). Prof. Manohar has been actively involved in promoting open and distance learning in India and has made significant contributions to the field. As an influential figure in the education community, he has played a vital role in shaping the direction and growth of IDEA.
I would now like to invite Prof. Murali Manohar to provide us with a brief overview of IDEA, its objectives, and its role in fostering innovation and excellence in open and distance learning. Over to you, Prof. Manohar.
Feedback regarding the meeting
About 35 participants gave their feedback out of 95 participants who participated during the meeting. The feedback given by them is analysed as under,

Based on the percentages, the following are the top 5 universities with the most participants in the meeting:Overall, the pie chart shows that the IDEA online meeting was well-attended by participants from a variety of universities. However, there were a few universities with a significantly higher number of participants than others. This suggests that some universities may be more interested in the IDEA online meeting than others.
- Maulana Azad National Open University (42.9%)
- School of Distance Education (2.9%)
- M.P. Bhoj (Open) University (2.9%)
- Indira Gandhi National Open University (IGNOU) (8.6%)
- Dr. BR Ambedkar Open University (14.39%)
The following are the bottom 5 universities with the least participants in the meeting:
- IGNOU Regional Centre (2.9%)
- Karnatak University (2.9%)
- Don Bosco Institute of Technology (2.9%)
- University of Mumbai (2.9%)
- Dibrugarh University (2.9%)The following are some observations from the pie chart:
- Maulana Azad National Open University had the most participants in the meeting, followed by the Indira Gandhi National Open University.
- The top 5 universities with the most participants accounted for 66.2% of the total participants.
- The bottom 5 universities with the least participants accounted for 14.7% of the total participants.
- The remaining 19% of the participants were from other universities that are not listed on the pie chart.
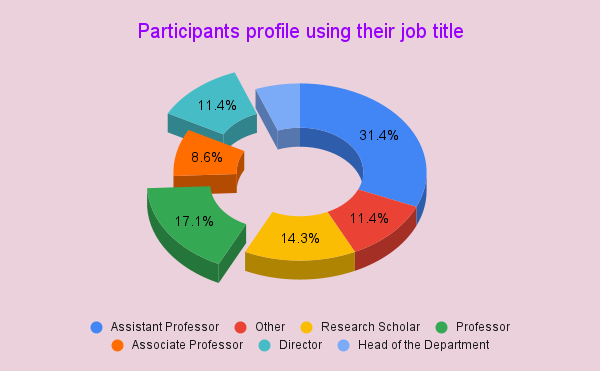
The image shows a pie chart with the job titles of the participants in the IDEA online meeting. The chart shows that the majority of participants were Assistant Professors (31.4%), followed by Research Scholars (17.1%), Professors (14.3%), and Associate Professors (11.4%).
The following are some observations from the pie chart:
- Assistant Professors made up the largest group of participants, which suggests that the IDEA online meeting was of interest to early-career academics.
- Research Scholars were the second largest group of participants, which suggests that the IDEA online meeting was also of interest to graduate students.
- Professors and Associate Professors made up a significant portion of the participants, which suggests that the IDEA online meeting was also of interest to more senior academics.
- Other job titles, such as Director, Head of Department, and Others, made up a small portion of the participants.
Overall, the pie chart shows that the IDEA online meeting was well-attended by participants from a variety of job titles. However, there were a few job titles with a significantly higher number of participants than others. This suggests that some job titles may be more interested in the IDEA online meeting than others.
- Here are some specific recommendations for improvement based on the pie chart:Reach out to more Assistant Professors and Research Scholars to encourage them to participate in future IDEA online meetings.
- Consider offering more sessions that are specifically designed for early-career academics and graduate students.
- Develop a more targeted marketing campaign to reach out to specific job titles that are not currently well-represented in the IDEA online meeting.

The bar graph shows the number of respondents who have provided feedback after the meeting, based on their current employment status. There are 3 respondents who have retired and 32 respondents who are still in service.
The following are some observations from the bar graph:
- The number of respondents who have retired is 3, which is the lowest number of cases.
- The number of respondents who are still in service is 32, which is the highest number of cases.

The bar graph shows the feedback from participants of the 6th Online Virtual Meeting of IDEA, based on how well-run and engaging they found the meeting. The graph shows that the majority of participants (65.71%) found the meeting to be well-run and engaging, followed by 28.57% who found it to be somewhat well-run and engaging. 2.86% of participants found the meeting to be neutral, and 2.86% found it to be somewhat poorly-run and engaging.
The following are some observations from the bar graph:
- The majority of participants found the meeting to be well-run and engaging, which is a good sign.
- There were a small number of participants who found the meeting to be somewhat poorly-run and engaging, which could be an area for improvement.
- The neutral and somewhat well-run categories make up a significant portion of the feedback, which suggests that there is room for improvement in some areas.

The bar graph shows the feedback from participants of the 6th Online Virtual Meeting of IDEA, based on how informative and valuable they found the meeting. The graph shows that the majority of participants (74.29%) found the meeting to be informative and valuable, followed by 24.29% who found it to be somewhat informative and valuable. 1.43% of participants found the meeting to be neutral, and 0% found it to be somewhat uninformative and valuable.
The following are some observations from the bar graph:
- The majority of participants found the meeting to be informative and valuable, which is a good sign.
- There were a small number of participants who found the meeting to be somewhat uninformative and valuable, which could be an area for improvement.
- The neutral category makes up a very small portion of the feedback, which suggests that there is little room for improvement in this area.

The bar graph shows the feedback from participants of the 6th Online Virtual Meeting of IDEA, based on how easy they found the meeting to understand. The graph shows that the majority of participants (65.71%) found the meeting to be easy to understand, followed by 31.43% who found it to be somewhat easy to understand. Only 2.86% of participants found the meeting to be difficult to understand.
The following are some observations from the bar graph:
- The majority of participants found the meeting to be easy to understand, which is a good sign.
- There were a small number of participants who found the meeting to be difficult to understand, which could be an area for improvement.
- The somewhat easy category makes up a significant portion of the feedback, which suggests that there is room for improvement in some areas.

The graph shows the feedback from participants of the 6th Online Virtual Meeting of IDEA, based on how knowledgeable the resource person was about the topic. The graph shows that the majority of participants (71.43%) found the resource person to be knowledgeable about the topic, followed by 25.71% who found them to be somewhat knowledgeable. Only 2.86% of participants found the resource person to be not knowledgeable about the topic.
The following are some observations from the graph:
The following are some observations from the graph:
- The majority of participants found the resource person to be knowledgeable about the topic, which is a good sign.
- There were a small number of participants who found the resource person to be not knowledgeable about the topic, which could be an area for improvement.
- The somewhat knowledgeable category makes up a significant portion of the feedback, which suggests that there is room for improvement in some areas.

The graph shows the feedback from participants of the 6th Online Virtual Meeting of IDEA, based on how they rated the personal approach and attitude of the expert/resource person in explaining and answering questions. The graph shows that the majority of participants (71.43%) strongly agreed that the resource person had a good personal approach and attitude, followed by 25.71% who agreed. Only 2.86% of participants somewhat agreed or strongly disagreed.
The following are some observations from the graph:
- The majority of participants strongly agreed that the resource person had a good personal approach and attitude, which is a very good sign.
- There were a small number of participants who somewhat agreed or strongly disagreed, which could be an area for improvement.

The graph shows the feedback from participants of the 6th Online Virtual Meeting of IDEA, based on how likely they are to recommend the meeting to their friends and colleagues. The graph shows that the majority of participants (68.57%) are very likely to recommend the meeting, followed by 22.86% who are somewhat likely. Only 8.57% of participants are not very likely or not likely to recommend the meeting.
The following are some observations from the graph:
- The majority of participants are very likely to recommend the meeting, which is a very good sign.
- There were a small number of participants who are not very likely or not likely to recommend the meeting, which could be an area for improvement.

The graph shows the feedback from participants of the 6th Online Virtual Meeting of IDEA, based on how they rated the overall quality of the meeting. The graph shows that the majority of participants (71.43%) rated the meeting as good or very good, followed by 25.71% who rated it as fair. Only 2.86% of participants rated the meeting as poor or very poor.
The following are some observations from the graph:
- The majority of participants rated the meeting as good or very good, which is a very good sign.
- There were a small number of participants who rated the meeting as fair or poor, which could be an area for improvement.

The image shows a bar graph with the following categories:
- Overall satisfaction: This category measures how satisfied the participants were with the meeting overall.
- Meeting agenda: This category measures how satisfied the participants were with the meeting agenda.
- Speakers: This category measures how satisfied the participants were with the speakers.
- Question and answer session: This category measures how satisfied the participants were with the question and answer session.
- Overall experience: This category measures how satisfied the participants were with their overall experience at the meeting.
The graph shows that the majority of participants were satisfied with the meeting overall (80%). The meeting agenda was also well-received (74%). However, the speakers and the question and answer session were less well-received, with only 65% and 62% satisfaction, respectively.
Overall, the image suggests that the meeting was well-received by the participants.
Findings of the Analyses
Here are the findings of the study from all the above analyses:
- The 6th Online Virtual Meeting of IDEA was generally well-received by participants.
- The meeting was found to be informative and valuable by the majority of participants.
- The resource person was found to have a good personal approach and attitude by the majority of participants.
- The meeting was found to be of good quality by the majority of participants.
- There are some areas where the meeting could be improved, such as the speakers and the question and answer session.


For the latest development and fee details contact President and Secretary General, IDEA.
Prof. K. Murali Manohar, President, IDEA (muralimanohark@yahoo.com
Prof. Romesh Verma, Secretary General, IDEA (romeshvermajammu@gmail.com)

Comments
Post a Comment